Will the U.S. and Iran reach a peace deal?
Views & insightsA peace treaty between the U.S. and Iran over the Strait of Hormuz is “tantalisingly close” – how are markets responding?
Key highlights
- Nuclear negotiations: The U.S. and Iran reached a preliminary agreement to extend the ceasefire in the Strait of Hormuz, potentially easing oil prices.
- Energy supply risks: Global oil inventories approached all-time lows as the Strait of Hormuz closure threatens industrial operations.
- Inflationary pressures: Central banks face a difficult balancing act as energy-driven inflation persists amid weakening economic growth.
Deal or no deal: Navigating the Strait of Hormuz crisis
Reports emerged late last week that the U.S. and Iran have reached a preliminary agreement to extend the current ceasefire by 60 days and open formal discussions on Iran’s nuclear programme.
Oil prices fell on the news, with Brent crude dropping to around $92 a barrel. However, it’s worth noting that the Brent crude price was over $120 a month ago. This demonstrates how volatile prices have been, and how quickly they can shift from driving up to weighing down monthly inflation.
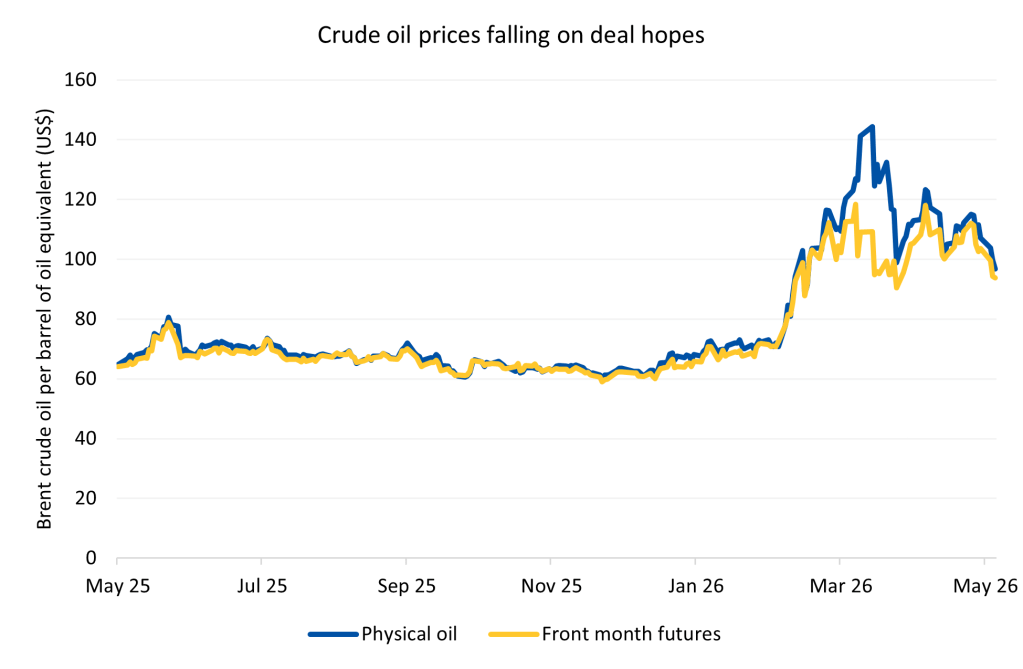
Source: Bloomberg
In details confirmed by multiple news agencies, an anonymous source suggests the memorandum of understanding between the U.S. and Iran would guarantee unrestricted shipping through the Strait of Hormuz, with Iran required to remove mines from the waterway within 30 days. Pakistan has been actively involved, acting as mediator.
However, speculation over the reopening of the Strait of Hormuz increasingly feels like Groundhog Day. Potential sticking points remain unresolved. Beyond the nuclear question, negotiators must resolve how much of Iran’s $24 billion in frozen assets will be released, and who controls traffic through the Strait of Hormuz in the future.
The most pressing issue of the moment has become how to resolve Israel’s active conflict with Lebanon. Iran’s semi-official Tasnim news agency reported that Iran would withdraw from negotiations with the U.S. while that conflict continues.
Last week, the U.S. also acted against Iran’s Persian Gulf Strait Authority, accusing it of extorting vessels seeking passage, with some ships receiving payment demands of up to $2 million for safe transit. Some factions within Iran believe this shows the country’s bargaining position is improving as summer approaches and inventory pressures intensify (see below for more detail). This is because Iran receives revenue through sanctions waivers and Strait transit fees, while using the ceasefire to rebuild military capabilities.
Over the weekend, the U.S. struck Iranian command and control sites in response to the downing of a U.S. drone. Iran, in turn, responded by targeting a U.S. base in Kuwait. These incidents continued alongside ongoing negotiations without breaking the current ‘ceasefire’.
Progress seems to have been made, even while the ceasefire itself comes under increasing strain. The summer months of June, July, and August represent the first genuine stress test of whether markets have been right to assume an early resolution.
The ticking clock
If a deal is eventually reached, the damage already done to global energy markets is considerable, and the window to prevent a crisis is narrowing.
The effective closure of the Strait of Hormuz since late February has removed up to around a fifth of the world’s oil and liquefied natural gas supplies from normal circulation. Global oil inventories, the buffer that allows the world to keep functioning when supply is disrupted, are approaching all-time lows. The Strategic Petroleum Reserve, a U.S. government-held stockpile, has been softening the impact.
The timeline, as RBC Capital Markets analysis makes clear, is stark. If inventory drawdowns continue at their current pace, the world could reach critically low levels of what analysts call ‘inventory cover’ – the number of days refineries can keep operating on existing stocks – by as early as October and potentially even sooner.
At below roughly 30 to 40 days of cover, normal industrial operations begin to break down, as refineries run short of the crude oil they need to function. RBC Capital Market analysis also suggests that the true pace of drawdowns may be understated, since inventory data from less transparent markets, such as China, is difficult to verify.
Collateral damage
The energy shock has created a deeply uncomfortable situation for central banks around the world.
Their primary mandate is to keep inflation under control – typically targeting a rate of around 2%. The conventional tool for doing so is raising interest rates, which makes borrowing more expensive and cools economic activity. The problem is that several major economies are already weakening, making aggressive rate rises potentially damaging.
Inflation data released last week confirmed that energy-driven price pressures are spreading.
In Europe, inflation reached 2.8% in France, 3.3% in Italy, and 3.6% in Spain in May. The European Central Bank is likely to increase rates at its June meeting even as the Eurozone economy weakens. The composite purchasing managers index, a broad measure of business activity, fell to a 31-month low in May, and France’s economy shrank in the first quarter of 2026.
Raising rates in a weakening economy to control prices affected by global supply, rather than local demand, seems futile to some.
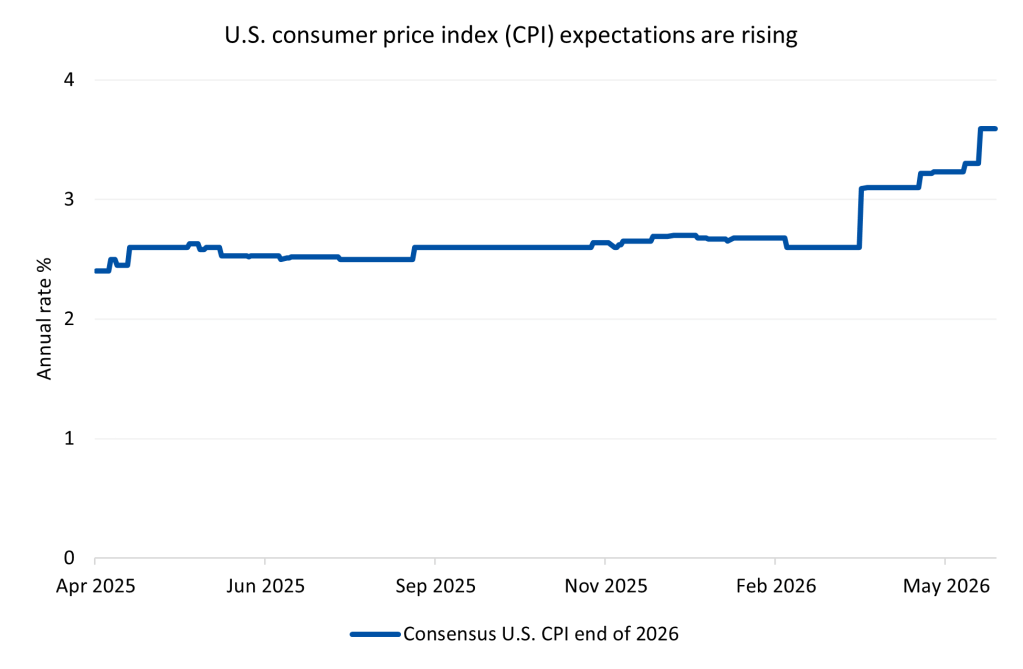
Source: Bloomberg
That debate is raging in the U.S., where professional forecasters have revised up inflation expectations to 3.6% for the end of 2026, and where inflation has been above the Federal Reserve (the Fed)’s 2% target for more than five years.
Former New York Fed President William Dudley warned last week that the Fed risks losing credibility if it continues to hold back. However, Minneapolis Fed President Neel Kashkari, currently a voting member, argued the opposite – that it’s too early to act without more data.
The broader picture is one of a world where supply disruptions – of which the Strait of Hormuz is the most consequential current example – are recurring often enough to be considered a feature, rather than a temporary shock. There are persistent sources of potential inflationary pressure, and central banks will continue to feel compelled to tighten policy even when growth is fragile.
A durable resolution to the Iran-U.S. war would provide meaningful relief. But as last week’s cautious, unconfirmed, still-contested reports remind us – that resolution remains some distance away.
Coming up
- Deal or no deal: Will last week’s leaks of a deal related to the Strait of Hormuz be confirmed officially? On what terms is the agreement being reached?
- Steady jobs growth: The U.S. is still expected to have created jobs at a modest pace in May.
- Rate setters: There are a lot of central bank speeches taking place, providing an opportunity to hear how they balance growth and inflation concerns.
The value of investments, and any income from them, can fall and you may get back less than you invested. Neither simulated nor actual past performance are reliable indicators of future performance. Investment values may increase or decrease as a result of currency fluctuations. Information is provided only as an example and is not a recommendation to pursue a particular strategy. Information contained in this document is believed to be reliable and accurate, but without further investigation cannot be warranted as to accuracy or completeness. Forecasts are not a reliable indicator of future performance. We or a connected person may have positions in or options on the securities mentioned herein or may buy, sell or offer to make a purchase or sale of such securities from time to time. For further information, please refer to our conflicts policy which is available on request or can be accessed via our website at www.brewin.co.uk.